Tuesday 22 May 2012

Willowglen May Have a Bullish Breakout - Can It be True?

Introduction:
Willowglen is primarily involved in developing SCADA system in the transportation, oil and gas, water and waste-water industries, security of buidings/high-end condominiums. The Group's revenue is principally contributed by its Singapore operation (80%), while the balance is coming from Malaysia. Currently the Group is exploring business oppurtunity in Indonesia. On the 22nd of May 2012, the Group has secured a contract amount RM 18mil which is expected to contribute positively to the EPS on FY2012 to FY2014.

Technical Analysis:
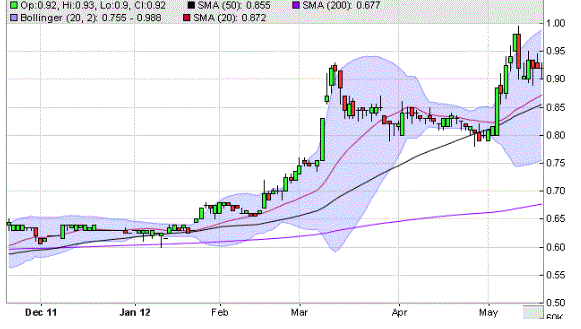
Indeed, prior to the announcement of the award of new contract, Willowglen share price has undergone a Bollinger breakup on the 21st of May 2012. From the volume plot, we are able to observe that the number of transactions has been increasing few days ago, which has surpassed its 40 day MA line. This is indeed a buying signal for this stock.
Figure 1: Share price history of Willow (source: www.tradesignum.com)

Fundamental Analysis:
The financial position of the Group is very healthy, with its current ratio stood at 10.25 at FY2011 and no borrowings.
Let's us have a look on the Group's history in terms of revenue from Table 1:

Table 1: Group earning history.

2011
2010
2009
Revenue (mil)
52.2
54.5
62.0
Net Profit (mil)
8.5
9.3
12.6
Profit Margin(%)
16.3
17.1
20.3
Inventory (mil)
1.3
1.2

EPS (RM)
0.034
0.038

PER
8.7
9.3


As seen, the Group's revenue started to decline from FY2009 to FY2011. Furthermore, its profit margin is downtrending which translates into declining of net profit. The declination of profit is mainly due to lower turnover from Malaysia operation and higher R&D costs. Its PER is consistent throughout all the years (i.e. ~ 9.0).

Willow has published its 4Q2011 result in past few months. The EPS is RM0.0151, which is quite a promising quarter for Willow. If we assume that Willow can make consistent profit in FY2012, the anticipated EPS throughout the year would be RM0.06 (2x EPS in FY2011). However, is Willow able to sustain this attractive EPS on 4Q2011 with its current project in hand?

Willow is going to publish its quarter result 1Q2012 soon. Let's us have a close look on it.


Sunday 20 May 2012

Muar Ban Lee Berhad - an attractive and undervalued counter

Introduction:

Muar Ban Lee Group (MBL) is a manufacturer of oil seed crushing machinery. MBL has successfully completed many oil seed crushing plants for major plantations and oil mills throughout the world. For further details, one may visit its webpage: www.mbl.com.


Fundamental Analysis:

Table 1: Income data of MBL.
  2011 2010 2009 2008 2007 2006 2005
Revenue (mil) 55.1 44.1 25.4 41.4 40.9 34.2 24.1
Net Profit (mil) 12.2 7.2 8.6 8.0 8.0 6.7 4.1
Profitability (%) 22.2 16.4 33.9 19.3 19.5 19.6 17.2
PER 4.7 7.8 6.7  
   
Total Borrowings (mil) 0 0 0.2        

From Table 1, MBL can be considered as a fundamentally sound company that deserve further attention. Its net profit has been increasing steadily from 2005 to 2011, albeit experiencing a slight drop in year 2010. Furthermore, the profit margin of about 20%-30% and zero borrowings are another attractive features that deserve serious attention into this stock.

Technical Analysis:

Figure 1: Historical price of MBL (source: www.tradesignum.com)

The stock is currently traded above its 20day MA line. Currently, the width of the Bollinger Band is experiencing marginal changes, indicating that the stock is experiencing a consolidation mode. Its immediate support is ~ RM 0.85.

Recommendation:

MBL is going to release its 1Q 2012 result soon. Considering its current PER (~7.0), this stock is very attractive for long term investment. However, by considering the current outlook of the global financial market, we should not trade heavily on this stock unless its PER has reached to its historially low value (<5). Let's wait for its 1Q 2012 result and we shall come to a more solid conclusion on the investment plan on this counter.

Plenitude Berhad posts a weak 3Q 2012 report

Company Background:
Plenitude Berhad is primarily involved in property development and listed in KLSE on year 2003.

Fundamental Analysis:
Since its listing on year 2003, its net profit has increased steadily from RM27.8mil (FY 2003) to RM 89.6mil (FY 2011). Even during the economic downturn on year 2008, Plenitude is able to record a profit of RM 80mil in FY2009, marginally higher than that in FY 2008 (RM 79mil) although the revenue drops from RM 348mil to RM 283mil.

Its trend of net profit attributed to shareholder can be seen from Figure 1:

 Figure 1: Net profit attributed to shareholder of Plenitude Berhad from year 1999 to year 2011.


As illustrated from Figure 1, Plenitude Berhad has demonstrated its capability in generating an uptrending trend of net profit from FY2003 to FY2011. Its relatively defensive business strategy as compared to other property developers in ensuring low level of borrowings (Interest / Operating Profit < 0.5% since its listing) is perhaps one of the key factors in keeping its profitability (Net Profit/Revenue) at a comfortable level (from 22% to 28%).

On the other hand, it is worth to have a look on its trend of revenue, as reported in Figure 2:

Figure 2: Total revenue of Plenitude Berhad from year 2004 to year 2011.

It can be observed that after the economic crisis happened in year 2008, Plenitude has been experiencing a wiggling trend of revenue generation. Although Plenitude is able to maintain its uptrending trend of net profit (see Figure 1) while experiencing an uneven trend of revenue, this is not a good sign and we shall be cautious on it. Let us have a look on its inventory level on year 2003 - 2011 in Figure 3:

Figure 3: Inventory level of Plenitude Berhad from year 2004 to year 2011.


Plenitude has a maximum inventory level of 18 mil (FY 2008), and it is deteriorating since then. This is not a healthy sign in maintaining its growing momentum of net profit. As quoted from its latest quarterly report (3Q 2012), the management has highlighted that no further revenue to be recognized arising from the completion of Batu Ferringhi Condominium and Phase 14 Double Storey Terrace Houses in Taman Desa Tebrau. Furthermore, the management anticipates a cautious outlook ahead due to the uncertainty in global economy.

Considering its PER on yearly basis, it can be summarised in the following table, Table 1. The PER is derived based on the closing share price at the end of the year.


Table 1: PER of Plenitude Berhad
Year 2011 2010 2009 2008 2007 2006 2005 2004
PER 5.9 6.9 4.5 3.1 6.3 3.9 3.4 3.9

As seen from Table 1, the share of Plenitude seems to be undermanding all the while, with its maximum PER is only 6.9 on year 2010. By assuming its net profit on 4Q 2012 to be comparable of that on 3Q 2012, its net profit on year 2012 would be around RM 64 mil which translates into EPS of RM0.23. By assuming that Plenitude is able to enjoy its maximum historical PER (i.e. 6.9) on year 2012, the share price of Plenitude would be RM 1.59.


Technical Analysis
As seen from Figure 4, the share price has been traded below its moving average line and meanwhile the width of the Bollinger Band is widening. This indicates that there is a big possibility of weakening of share price in the near future.

Figure 4: Bollinger band of Plenitude's share price. (source: www.tradesignum.com)


Suggestion
Undoubtedly, Plenitude Berhad is a fundamentally sound company proven by its strong balance sheet. However, by considering its possible weakening of net profit in the near future and bad technical outlook, we shall take a cautious outlook on this stock.